🎓 Learning corner
Classification metrics
Use these metrics when a system decides whether something belongs to a class: cat or not cat, name or not name, sensitive or not sensitive.
Background
Imagine a system that looks at 100 photos and predicts either Cat or Not Cat. The four boxes below are the starting point for precision, recall, and F1.
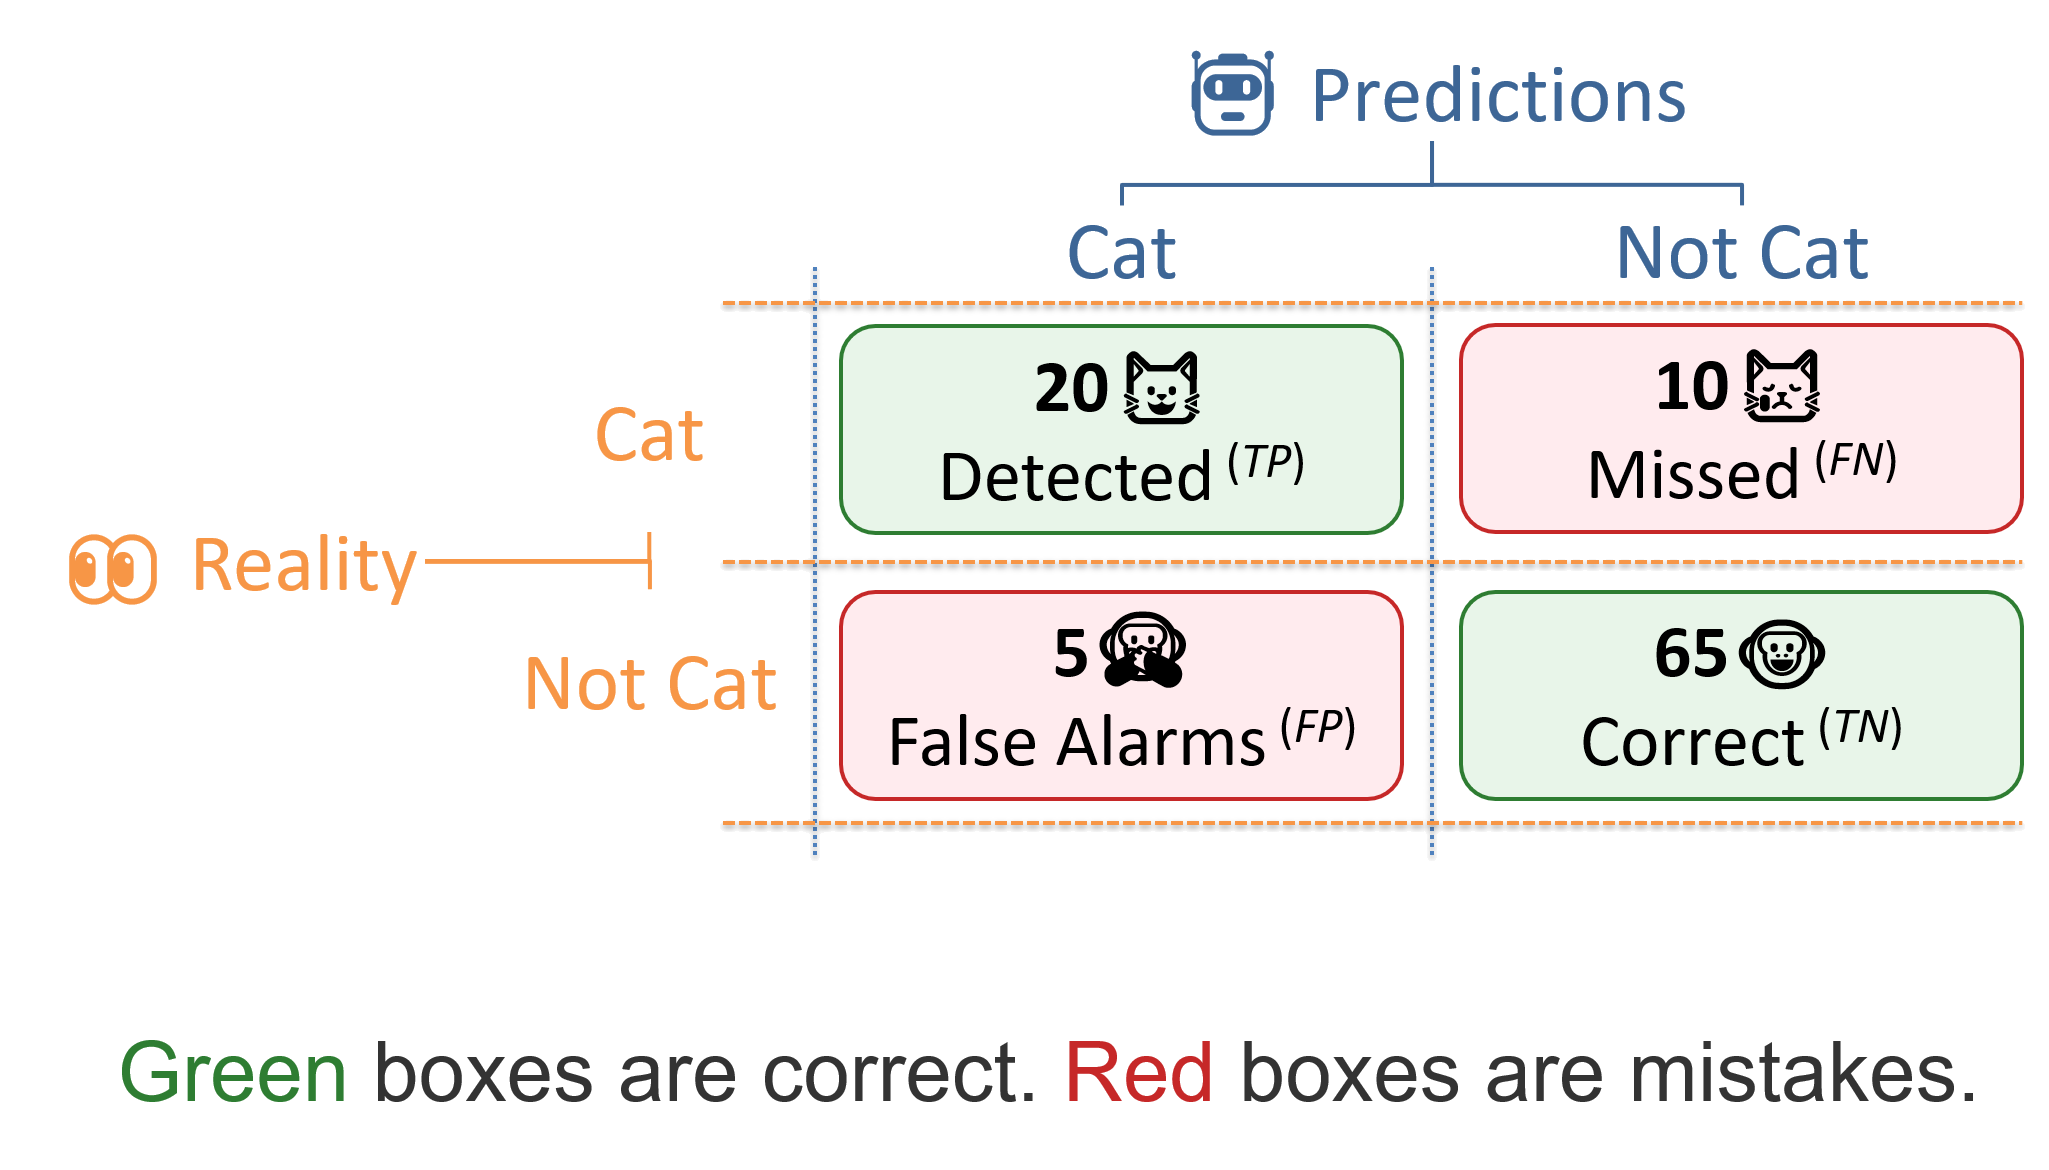
Correct decisions
20 real cats were detected, and 65 real non-cats were correctly rejected.
Mistakes
5 non-cats were false alarms, and 10 real cats were missed.
🎯 Precision
Precision looks only at the items the system selected. In the cat example, the system predicted 25 photos as cats. 20 really were cats and 5 were false alarms.
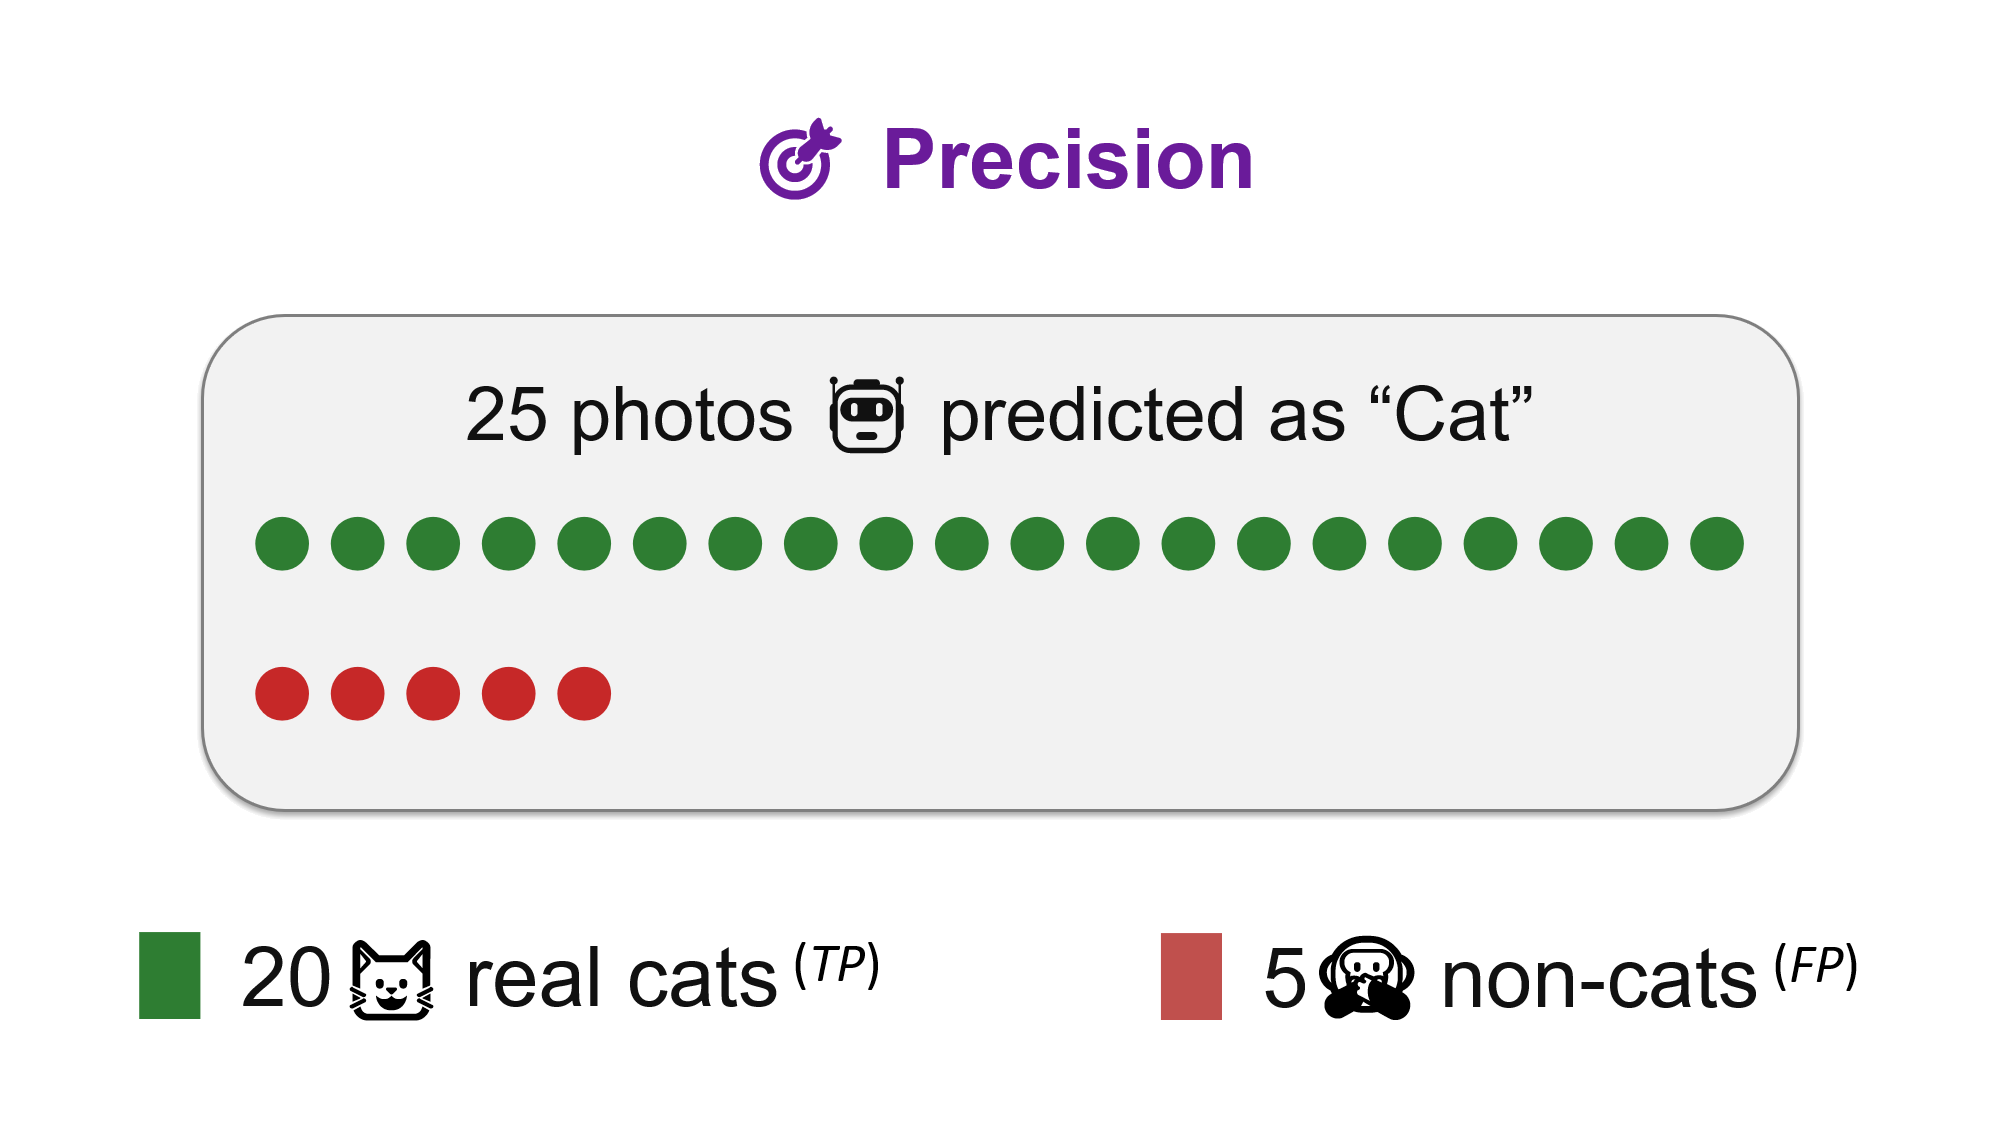
Precision = TP / (TP + FP)Precision = 20 / (20 + 5) = 80%
High precision means: when the system makes a claim, users can usually trust it. This matters when false alarms are costly.
🔍 Recall
Recall looks at all the truly relevant items. In the cat example, there were 30 real cats. The system found 20 and missed 10.
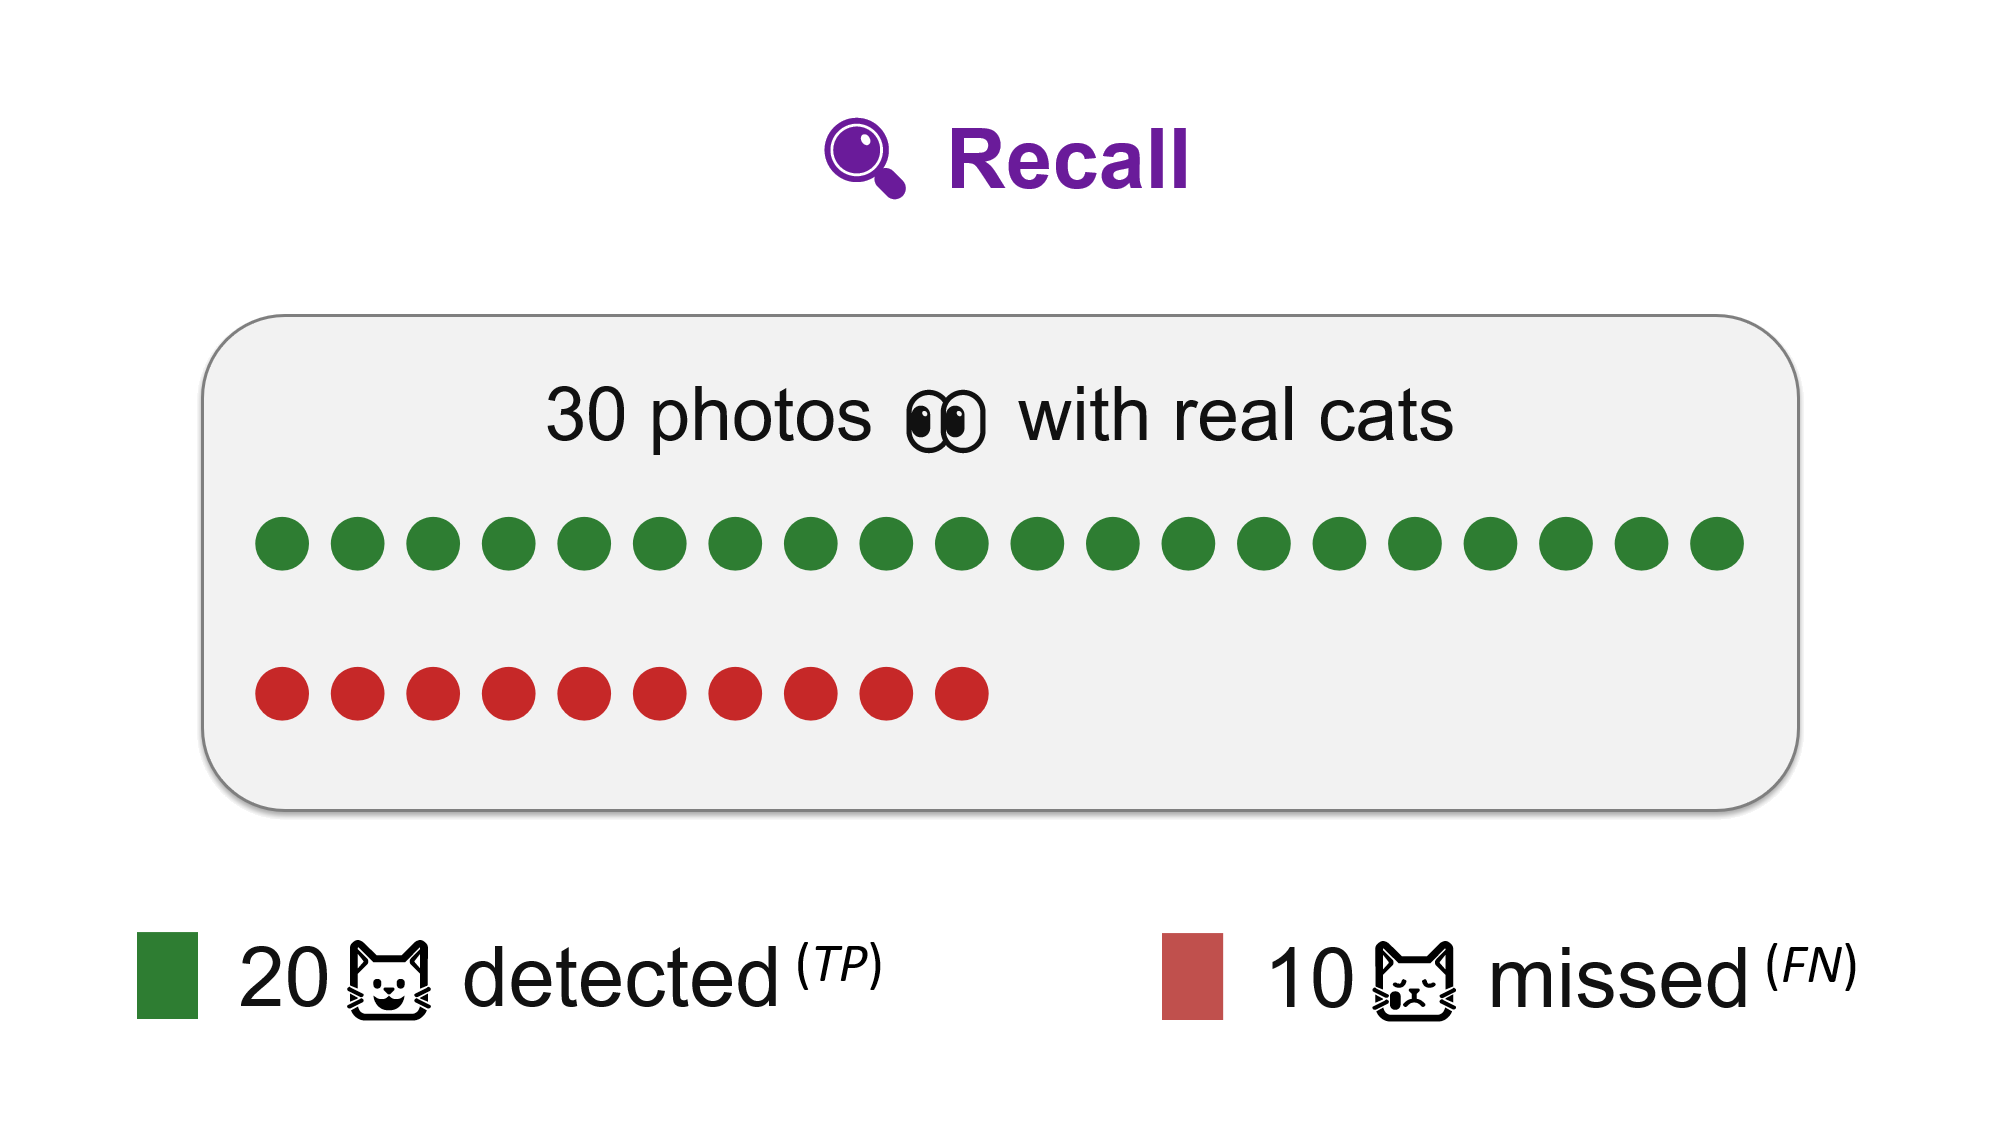
Recall = TP / (TP + FN)Recall = 20 / (20 + 10) = 66.7%
High recall means: the system does not miss many of the things we care about. This matters when missing an item is more harmful than reviewing an extra false alarm.
⚖️ F1 Score
F1 combines precision and recall into one stricter balance score. It is high only when the system is both careful and complete.
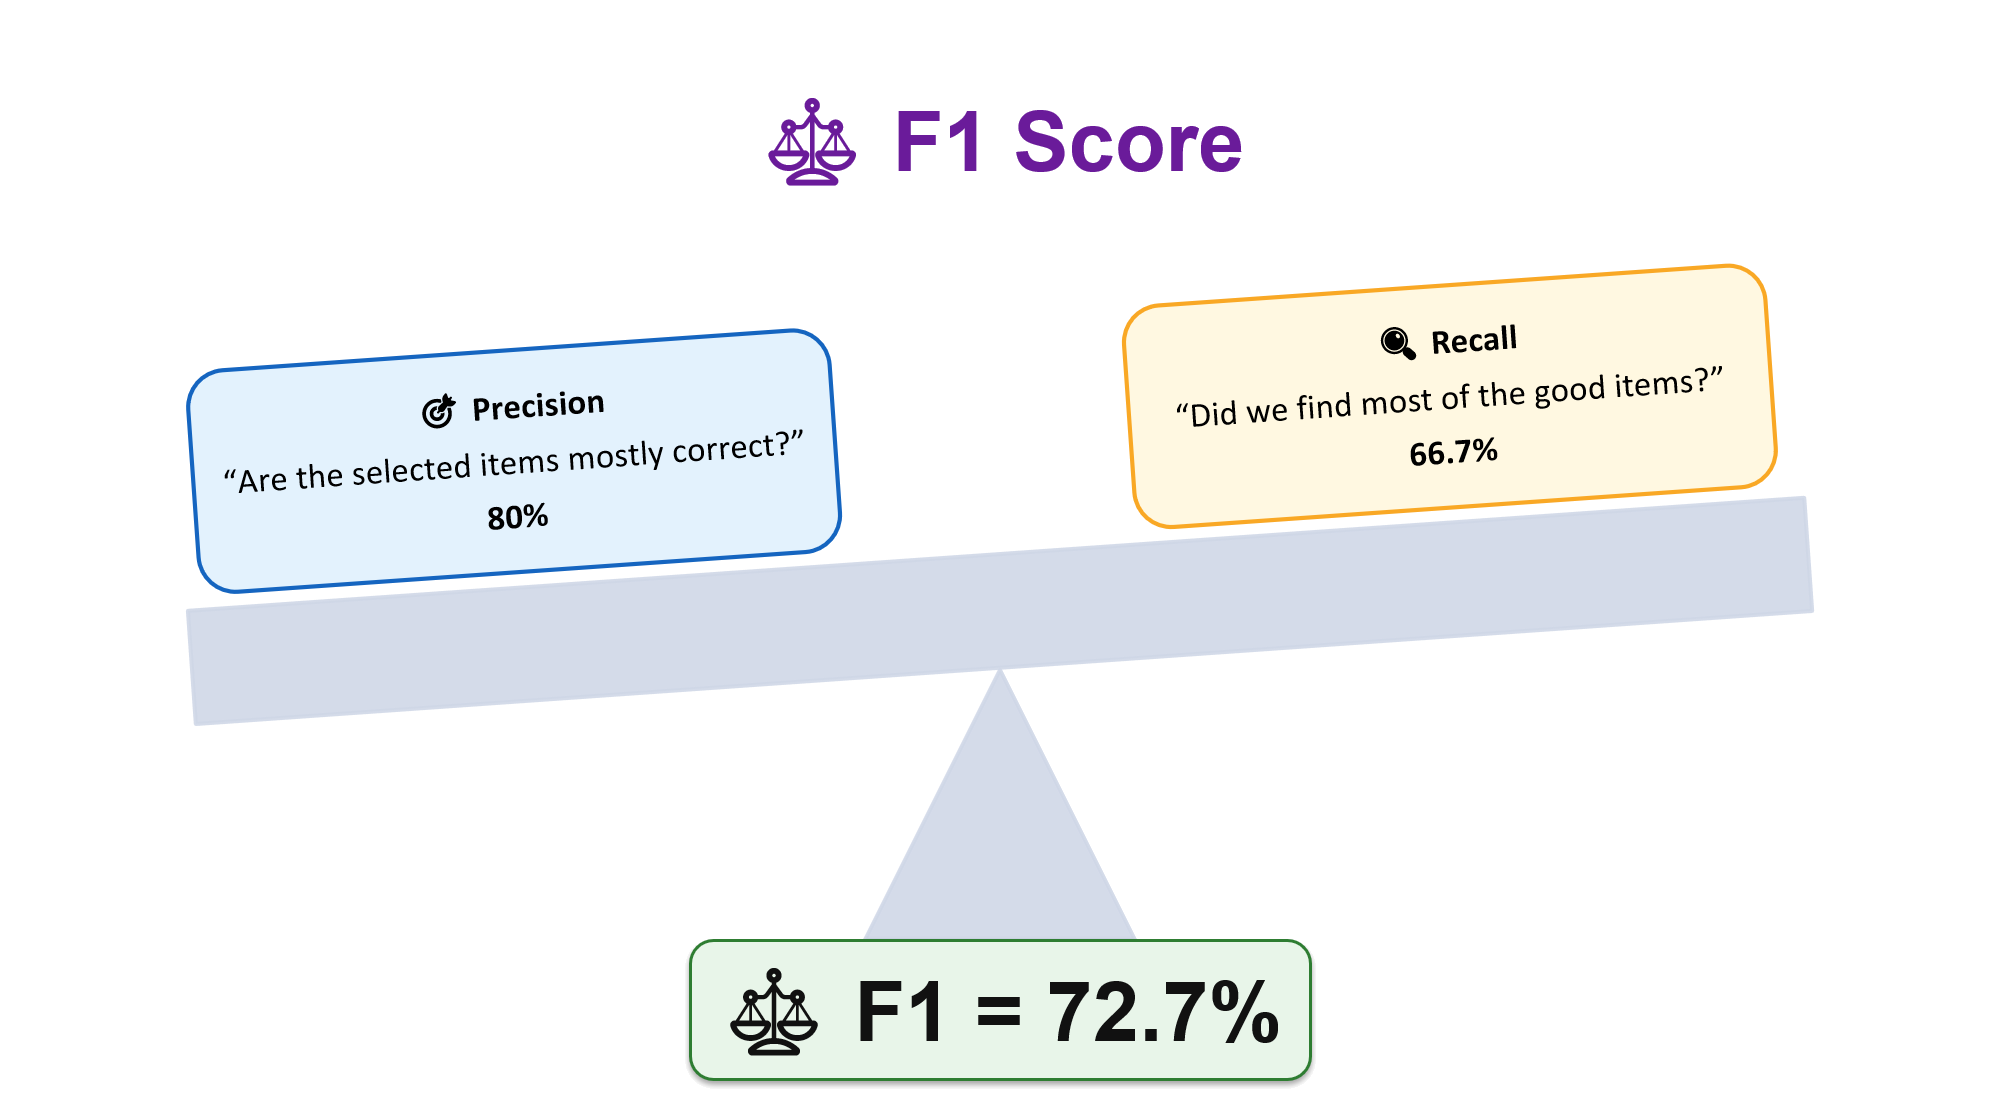
F1 = 2 × (Precision × Recall) / (Precision + Recall)F1 = 2 × (0.80 × 0.667) / (0.80 + 0.667) = 0.727 = 72.7%
F1 is useful when both kinds of mistakes matter: false alarms waste time, but missed items are also risky.